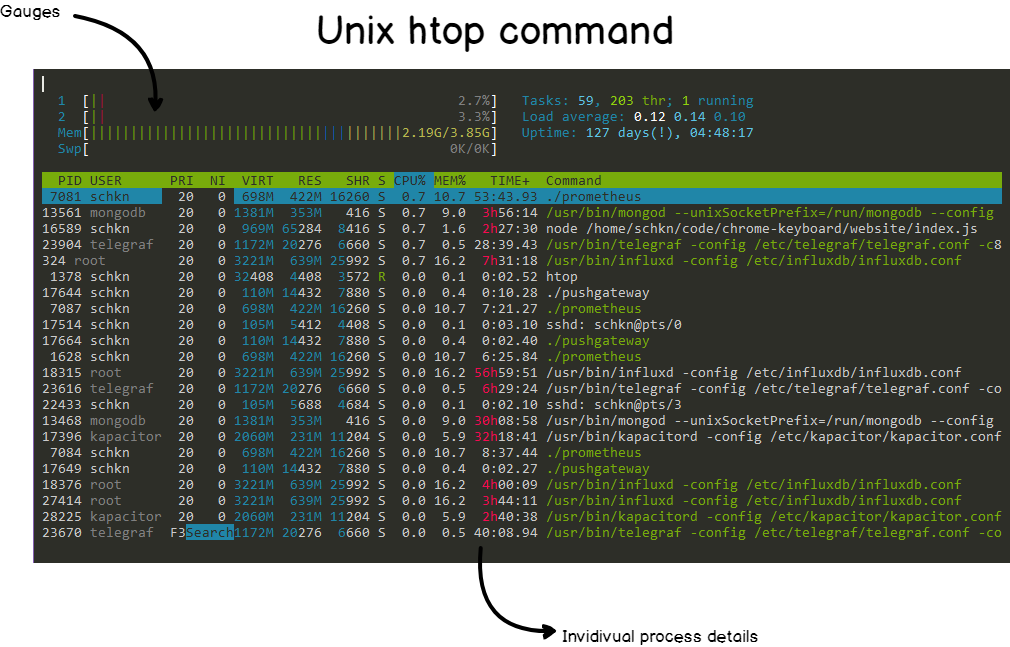
Overall you have two ways to monitor processes at Linux host
- Static monitoring
- Interactive monitoring
Static monitoring
The most widely used command is ps (i.e., process status) command is used to provide information about the currently running processes, including their process identification numbers (PIDs).
Here a few useful options to gather specific information.
List processes in a hierarchy
$ ps -e -o pid,args --forest
List processes sorted by % CPU usage
$ ps -e -o pcpu,cpu,nice,state,cputime,args --sort pcpu | sed '/^ 0.0 /d'
List processes sorted by mem (KB) usage.
$ ps -e -orss=,args= | sort -b -k1,1n | pr -TW$COLUMNS
List all threads for a particular process (“firefox-bin” process in example )
$ ps -C firefox-bin -L -o pid,tid,pcpu,state
After finding a specific process you can gather information related to it using lsof to list paths that process id has open
$ lsof -p $$
Or based on path find out list processes that have specified path open
$ lsof ~
Interactive monitoring
Most commonly known tool for dynamic monitoring is:
$ top
That mostly default command that has a huge amount of options to filter and represent information in real-time (in comparison to ps command.
Still, there are more advanced options that can be considered and installed as top replacement
$ htop -d 5
or
$ atop
Which has the ability to log all the activities into a log file (default atop will log all the activity on every 600 seconds) To this list there are few specialized commands as iotop or iftop
$ sudo iotop
